

New Interactive Maps Show Chemical Risks in Legislative Districts
by Amanda Starbuck, 10/27/2014

As we near the midterm elections, voters are considering many important issues, from the economy to fair wages to health care. But have you considered whether children in your legislative district are safe from chemical disasters? New interactive maps released by the Center for Effective Government show the percentage of schoolchildren at risk of chemical catastrophes in congressional districts and state legislative districts. The results are alarming.
Each map shows that these chemical risks to schoolchildren are spread widely across the country, but the greatest risks are often concentrated in major urban areas. That's where industrial facilities and their dangerous chemicals are often in close proximity to communities and schools.

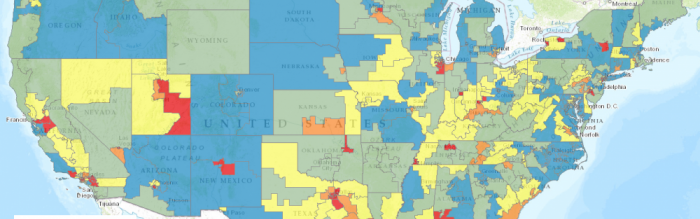
Figure 1: Congressional District Map
As Figure 1 shows, there are a substantial number of districts in the upper tier with between 80 and 100 percent of their students at risk.
Congressional Districts with the Greatest Concentration of Risk
The congressional district map shows that the greatest concentration of risk lines the shores of the Gulf of Mexico. Most of the coastal congressional districts from Corpus Christi, Texas to Mobile, Alabama are in the top risk tier, meaning that over 80 percent of their students are at risk of a chemical disaster.
The map also displays hot spots around many large- to medium-sized cities including Los Angeles, New York, Chicago, Miami, Houston, and Baton Rouge.

Figure 2: Gulf coast area including Houston, TX and Baton Rouge, LA.
However, living in a metropolitan area does not always mean that your children will be at risk. Districts encompassing other major cities like Seattle and Boston have relatively few students at risk of chemical catastrophes when compared to the national average.
Similarly, living away from a major urban area does not necessarily mean that your kids are safe from these chemical facilities. There are numerous districts in rural areas that face heightened risks. For instance, in Nevada’s second district, which covers its largely rural northern half, 58 percent of students are in danger zones. Utah is another example of a largely rural state whose districts have an above-average percentage of students at risk (52 percent or more).

Figure 3: Nevada and Utah
The map also shows that chemical facility hazards are unevenly distributed even within states. In California, where 49 percent of pre-K through 12th grade students go to school in danger zones, 13 congressional districts rank in the highest risk tier – more than any other state. These include the areas surrounding Los Angeles and Stockton. Compare this with the 14th and 18th congressional districts in the Bay Area, where not a single school is in a danger zone. Breaking the map into congressional districts shows where these risks are concentrated and where representatives need to prioritize chemical safety.

Figure 4: California, showing San Francisco to the north and Los Angeles to the south.
State Legislative Districts Where Kids Are Most at Risk
The state legislative district map tool uses side-by-side maps displaying the lower and upper chambers of each state's legislature (note that Nebraska and the District of Columbia have single-chamber legislatures). In most states, lower chambers are called "House" or "Assembly." Upper chambers are almost always known as the "State Senate."
Nationally, there are 1,035 lower-chamber districts and 362 upper-chamber districts where over 80 percent of students are at risk of a chemical disaster. Texas has the highest number of lower-chamber districts (66) with the greatest concentration of risk, while Rhode Island has the highest number of upper-chamber districts (23). In Rhode Island, the majority of these districts surround Providence, where a bleach manufacturing facility has a large danger zone that engulfs several districts.
Since state legislative districts are smaller and more local than congressional districts, these maps help to zero in on specific areas of risk within states. This is especially helpful in states with few congressional districts. North Dakota, for instance, has one congressional district that covers the entire state. Twenty-six percent of its schoolchildren study in chemical danger zones, but it is impossible to understand where these risks are concentrated by examining the statewide congressional district information. However, the state legislative maps show that the areas with the most risk surround Fargo and Bismarck, the state’s two largest cities. This provides insight into the areas most in need of attention.
Of course, preventing chemical disasters should be a priority for all state legislators and congressional representatives. Our elected officials need to strengthen chemical safety at home and demand national chemical safety reform on the federal level.
New Tools Part of Larger Kids in Danger Zones Project
The new maps build off of our recent interactive schools and facilities map and report, Kids in Danger Zones, that found that at least one in three U.S. schoolchildren is at risk of a chemical catastrophe. We mapped around 3,400 hazardous facilities as well as every public and private school in the nation (preschool through 12th grade). We found that almost 20 million children in nearly 40,000 schools are in danger zones. These new maps are another tool to help communities learn about the risks in their districts and ask candidates and elected officials important questions about preventing chemical disasters.
You Can Take Action on Chemical Safety
Our maps help communities understand their level of risk and put pressure on officials to address chemical safety and disaster prevention. You can begin by researching your candidates’ stances on chemical safety. Are they aware of these risks and do they plan to address them? Do they support transparency of chemical information to help communities prepare for and prevent disasters? You can even share the link with your candidates’ campaign office or bring a screenshot to a local debate.
There are additional steps we can all take to reduce these risks:
- Learn more about these risks by viewing our interactive map, national report, and state factsheets.
- Share this information with local officials and ask if they have emergency response plans in place. Talk to your child’s school and urge them to practice chemical safety drills.
- Give teachers curriculum materials that help students explore the map and take action.
- Inform others in the community about these risks. Write a letter to the editor of your local paper. Share the map and report with local officials and urge them to take action.
By educating state and local leaders on these risks and demanding action, we can protect our children from chemical catastrophes. For additional resources, visit the Kids in Danger Zones landing page.